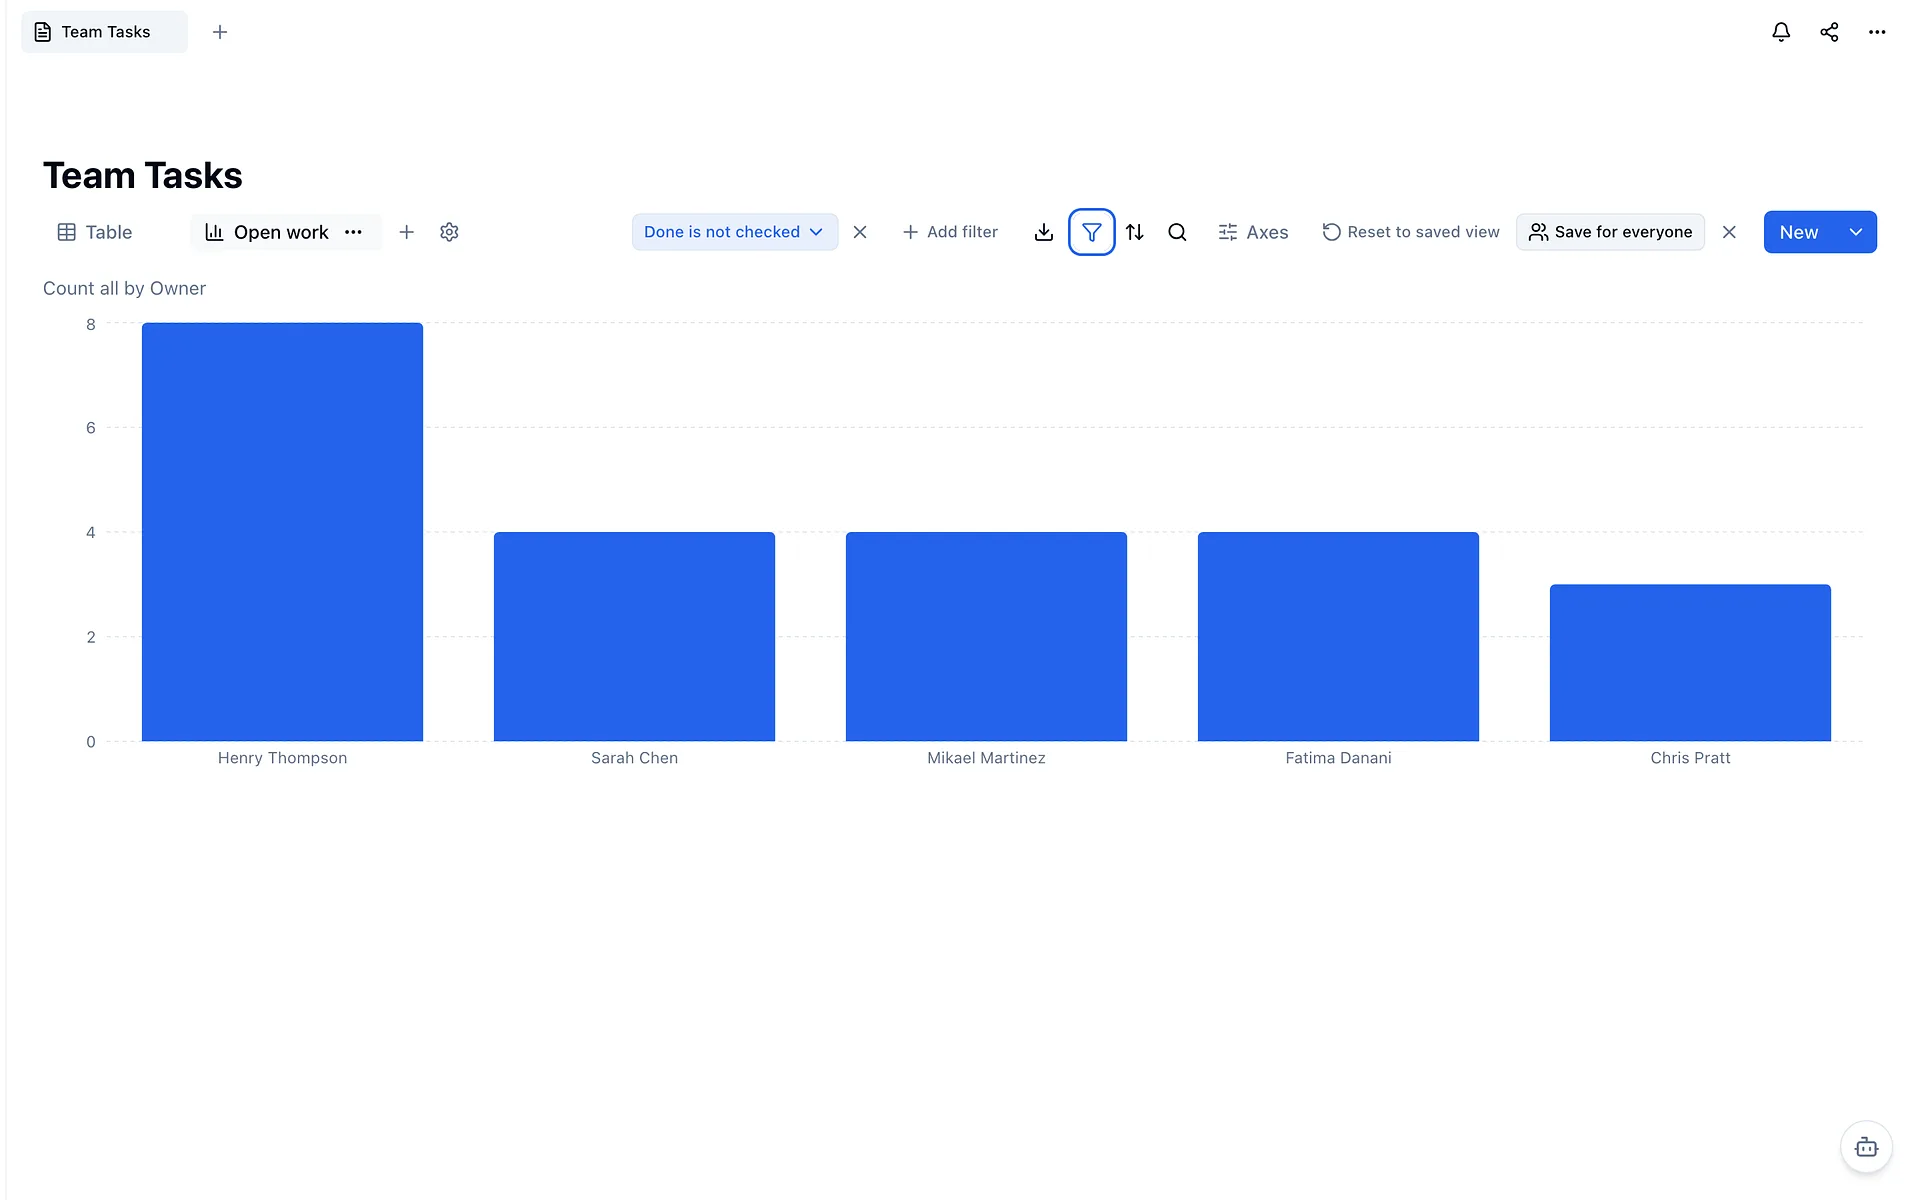
Chart Open Work by Owner
Chart the tasks nobody has finished by who owns them, so the heaviest load is a bar you can see instead of a question nobody answers.
Start from the task list you already keep
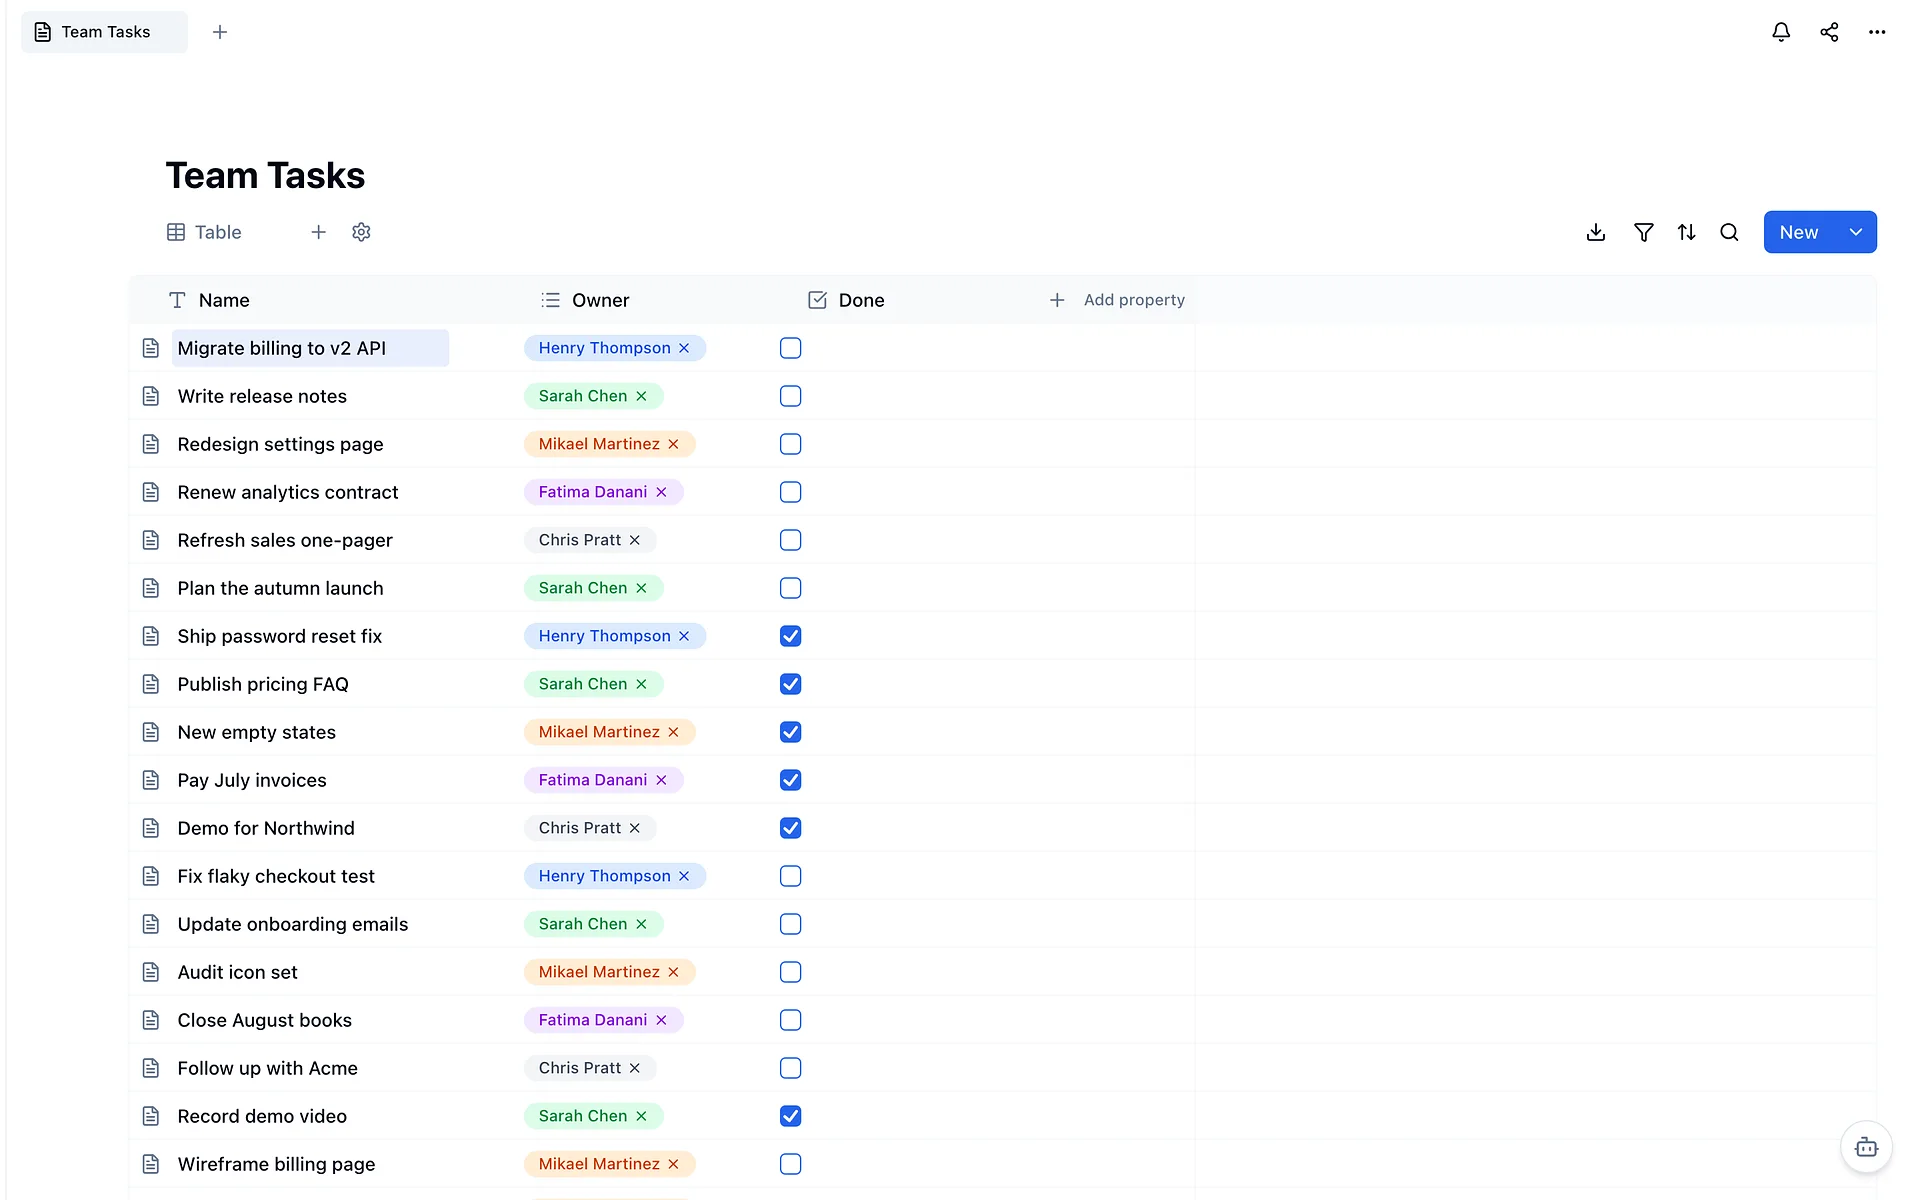
Open the database your team tracks work in. It needs two columns: an Owner select with one option per person, and a Done checkbox. Every row is one task.
Add a Chart view
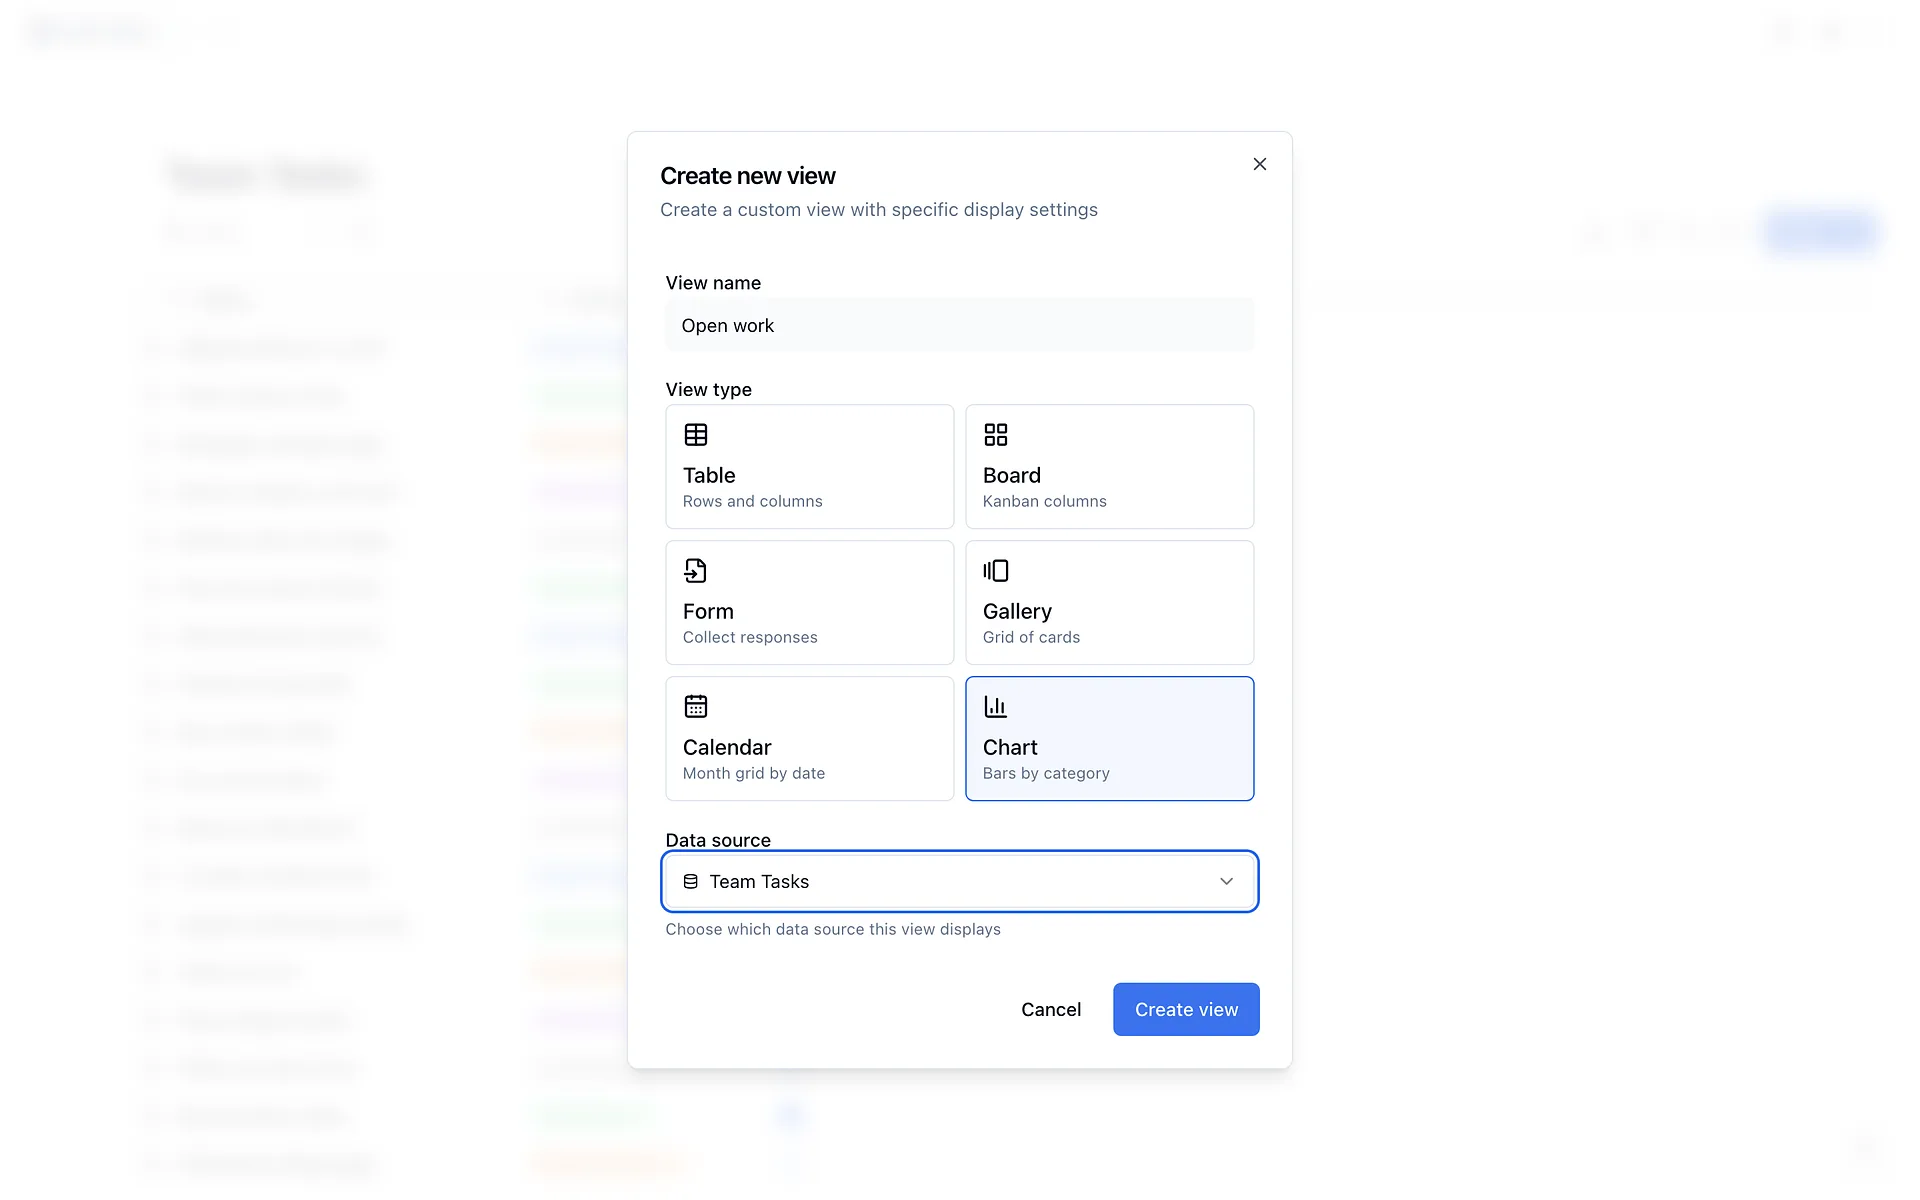
Click the + beside the view tabs. Name the view Open work, choose Chart, pick your task database as the data source and click Create view.
Group by Owner and count rows
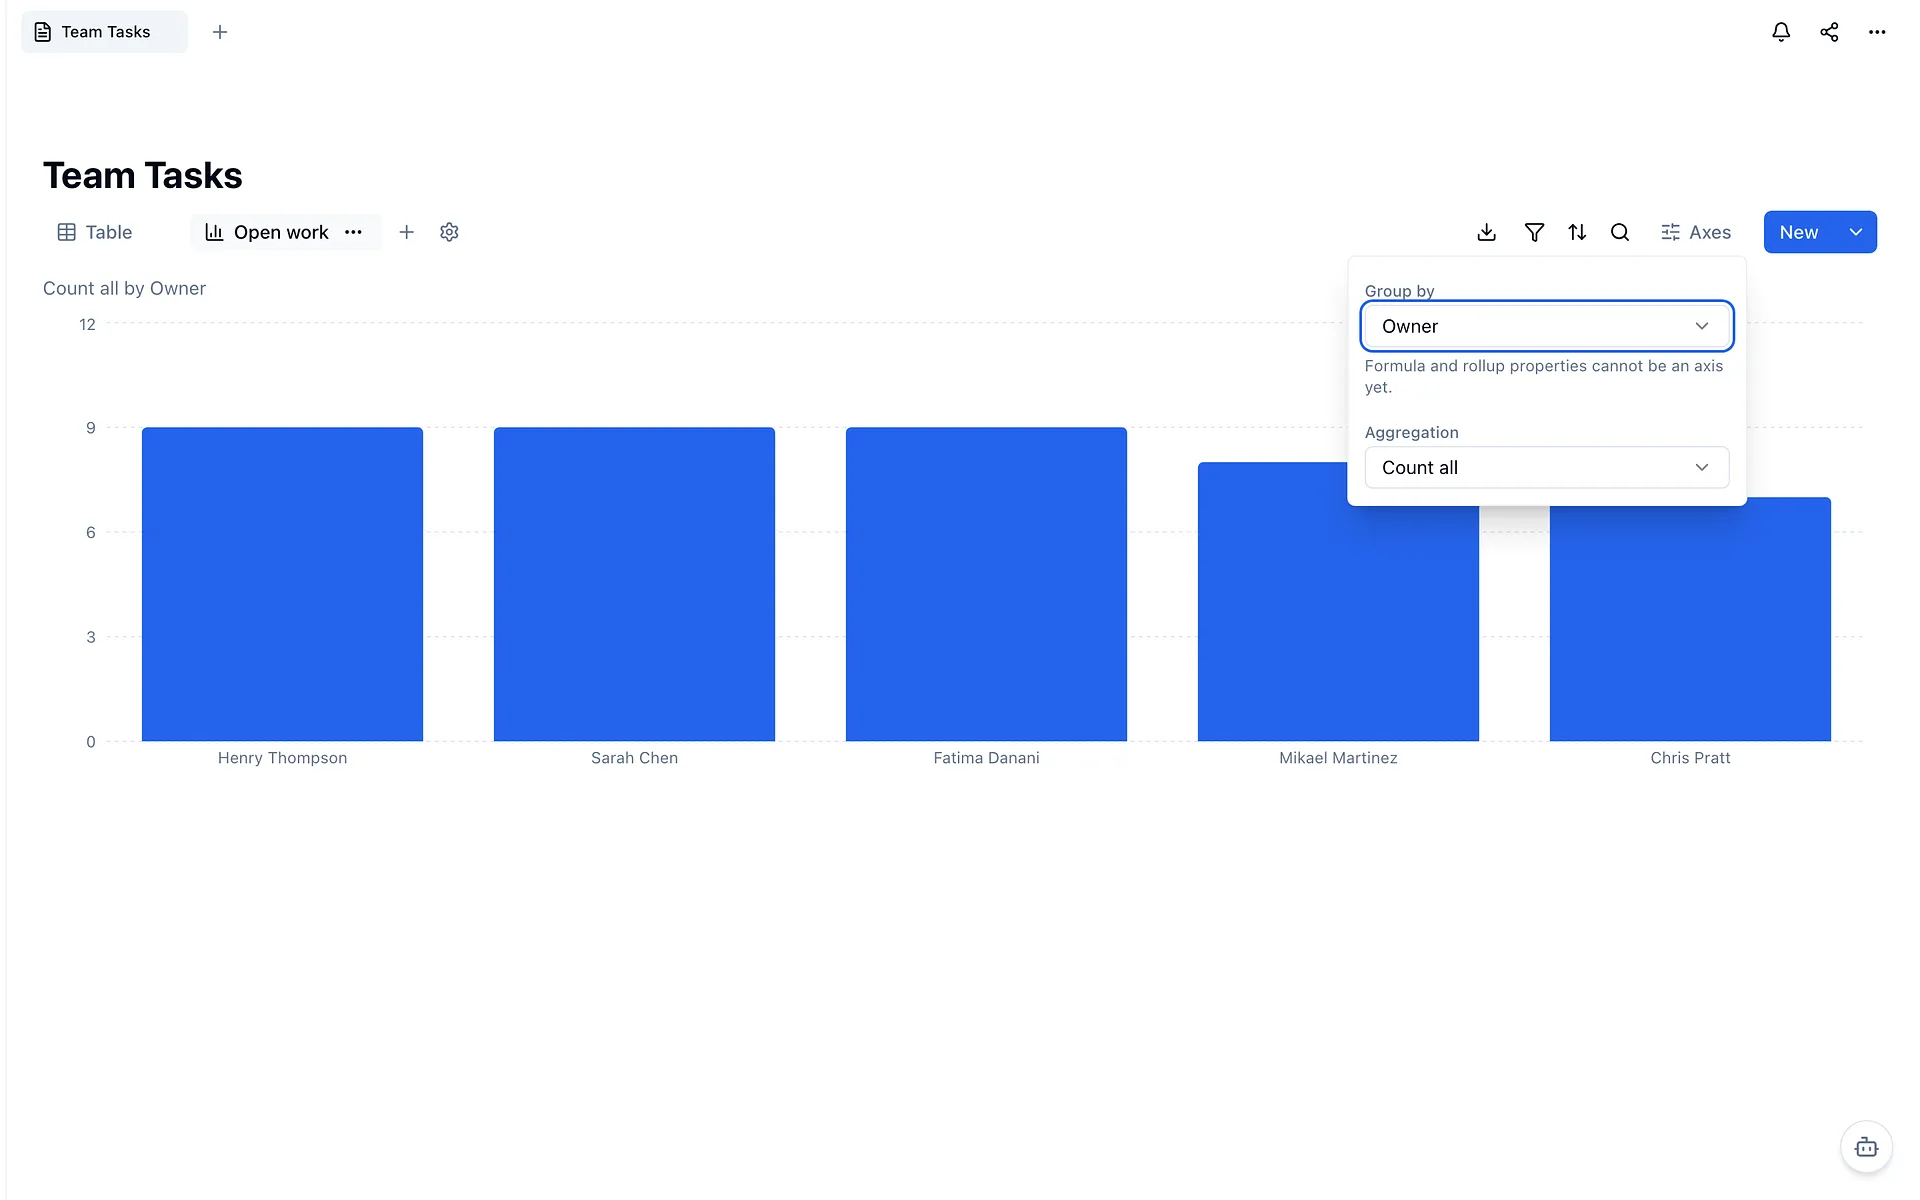
Click Axes. Set Group by to Owner and Aggregation to Count all. You get one bar per person, and the caption above the chart reads Count all by Owner.
Filter out finished work
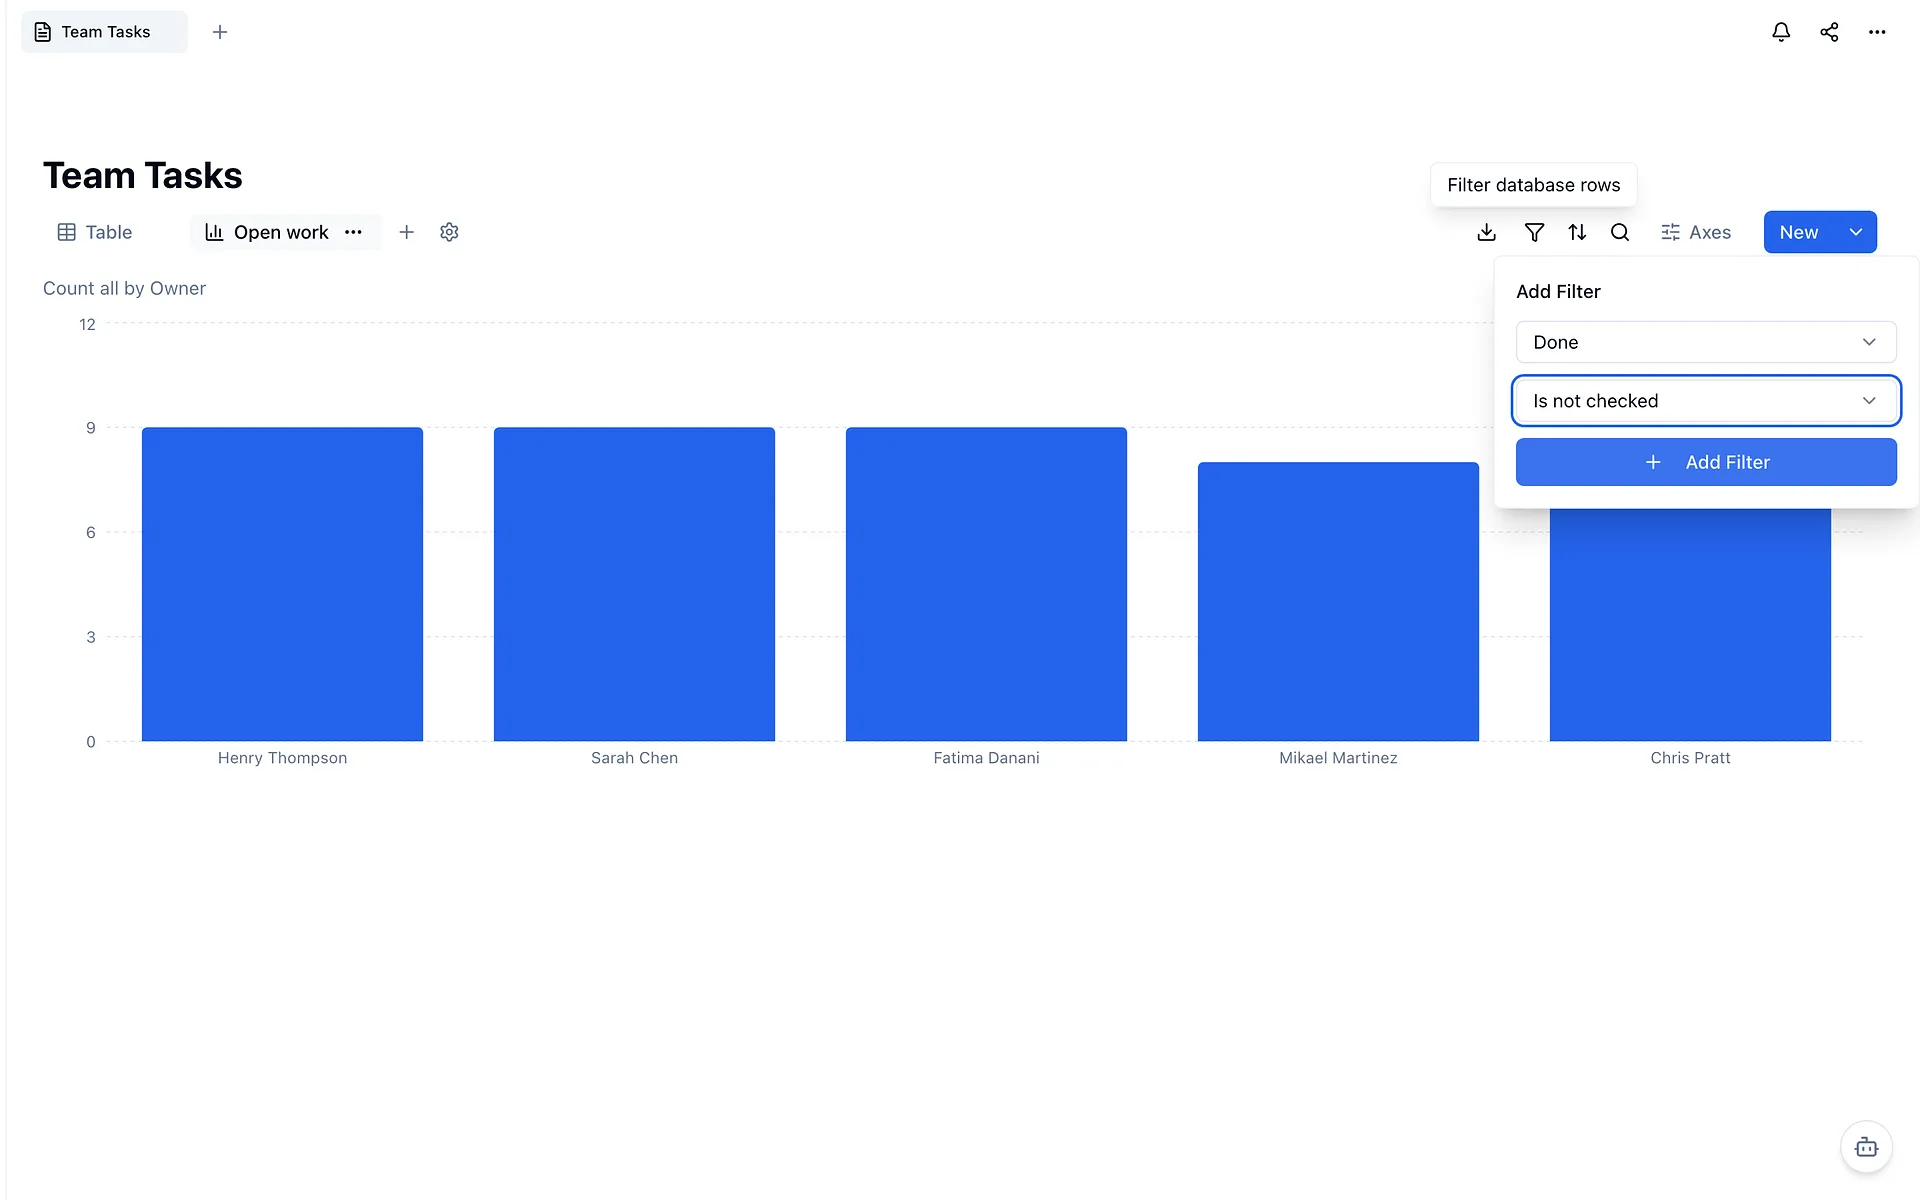
Click the filter icon, choose Done, then Is not checked, and click Add Filter. A chart counts only the rows its view's filters leave, and a filter on the table does not carry over, so add it here.
Read the tall bar
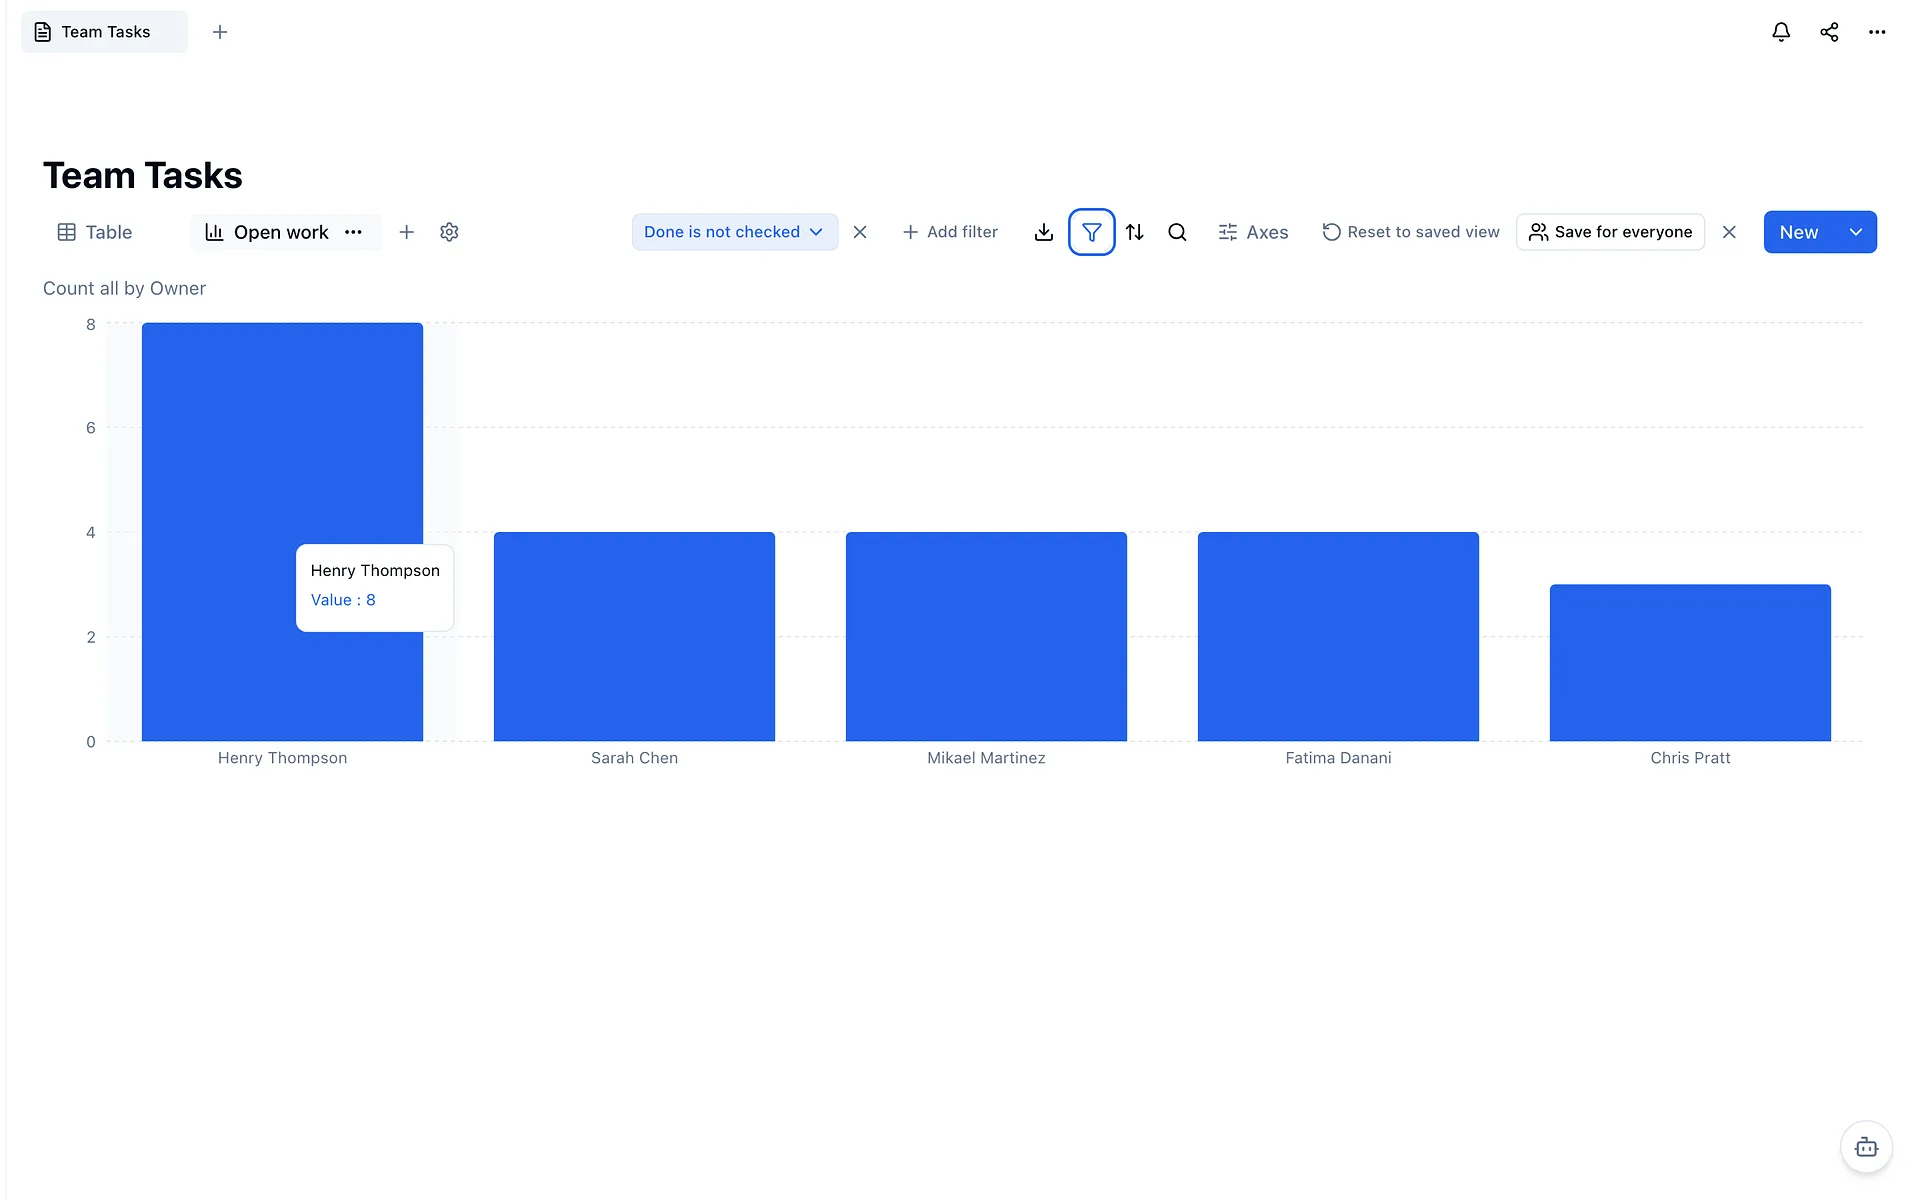
The bars redraw to count open work only. Hover a bar to see its exact number. Here, every task ever assigned looked even, and open work shows one person carrying 8 against 4, 4, 4 and 3.
Save it for the whole team
Click Save for everyone. The filter and axes are saved on the view, so anyone who opens Open work sees the same chart without setting it up.